
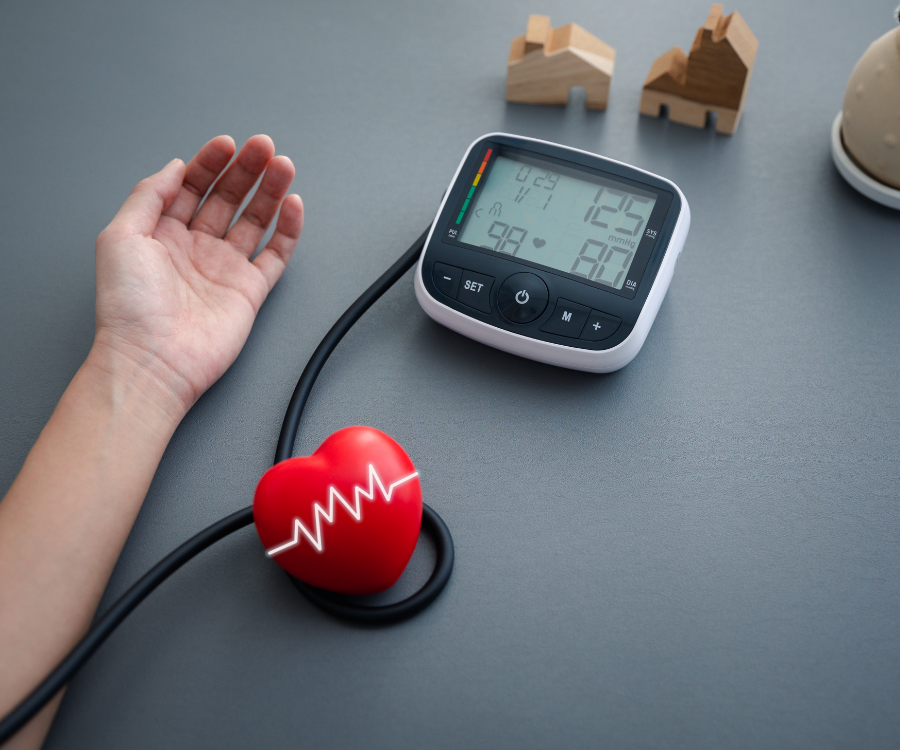
A routine checkup usually leaves you with two distinct pieces of health data: the cuff reading taken from your arm within minutes of sitting down, and a lab report filled with acronyms like eGFR, LDL, and HbA1c that lands in your inbox days later.
Most people treat them as unrelated tests. In reality, your cardiovascular system and your blood chemistry operate as an interdependent loop. A spike in blood pressure damages the very organs your blood tests monitor, while metabolic changes in your blood frequently force your blood pressure to climb. Reading them together gives you the complete picture.
Why Blood Pressure and Lab Work Are Inseparable
Blood pressure measures the mechanical force exerted against arterial walls as your heart pumps blood. Blood tests measure the metabolic and biochemical environment flowing inside those same vessels.
When blood pressure runs high (hypertension), it acts like excessive water pressure running through delicate domestic plumbing. Over time, that continuous mechanical strain scars arterial walls, accelerates plaque buildup, and injures microvascular capillary beds—most noticeably in the kidneys, brain, and retina. Conversely, if your blood is thick with excess glucose or inflammatory markers, the vessel walls stiffen, driving mechanical pressure even higher.
3 Critical Cross-Connections to Look For
Connecting the dots between your arm cuff readings and lab numbers highlights where your cardiovascular risk actually stands.
1. High Blood Pressure + Kidney Markers (Creatinine, BUN, eGFR)
The kidneys filter around 180 liters of blood daily through delicate clusters of tiny blood vessels called glomeruli.
- The connection: Uncontrolled high blood pressure is one of the leading causes of chronic kidney disease. As high pressure damages renal microvessels, the kidneys lose their ability to filter waste effectively.
- What to watch: If your blood pressure consistently reads 130/80 mmHg or higher, closely monitor your eGFR (estimated glomerular filtration rate, where higher is better) and Serum Creatinine (waste product, where lower is better). An eGFR drifting below 60 or elevated creatinine paired with high blood pressure signals early kidney stress.
2. High Blood Pressure + Lipid Panel (ApoB, LDL-C, Triglycerides)
Plaque formation requires both circulating material and an entry point into the vessel wall.
- The connection: Mechanical shearing from elevated blood pressure creates microscopic tears and chronic inflammation in the arterial endothelium (the inner lining). Circulating low-density lipoproteins—specifically atherogenic particles marked by Apolipoprotein B (ApoB) and LDL cholesterol—penetrate these tears, oxidize, and build atherosclerotic plaque.
- What to watch: Moderate blood pressure combined with high LDL is often far riskier than either factor alone. Elevated triglycerides alongside low HDL often indicate insulin resistance, which directly drives arterial stiffness.
3. Elevated Blood Pressure + Blood Sugar (HbA1c, Fasting Glucose)
Metabolic dysfunction and vascular dysfunction routinely travel together.
- The connection: Chronically high circulating glucose bonds with proteins and fats in a process called glycation, producing advanced glycation end-products (AGEs). AGEs damage vessel elasticity, deactivate nitric oxide (the molecule that signals blood vessels to dilate and relax), and provoke systemic fluid retention.
- What to watch: An HbA1c of 5.7% or higher (prediabetes range) accompanied by elevated systolic pressure suggests your blood vessels are actively losing elasticity.
Diagnostic Cheat Sheet: What the Numbers Tell You
| Metric | Optimal Target | What It Measures | When Paired with Elevated BP |
| Blood Pressure | < 120/80 mmHg | Mechanical wall tension | The baseline mechanical strain on vessels |
| eGFR | > 90 mL/min/1.73m² | Kidney filtration capacity | Declines indicate microvascular renal damage |
| Creatinine | ~0.6–1.2 mg/dL | Metabolic waste filtration | Elevation confirms reduced kidney clearance |
| ApoB / LDL-C | ApoB < 80 mg/dL; LDL < 100 mg/dL | Circulating plaque builders | Accelerates arterial narrowing and heart attack risk |
| HbA1c | < 5.7% | 3-month blood sugar average | Accelerates vessel stiffness and endothelial injury |
| hs-CRP | < 1.0 mg/L | Systemic vascular inflammation | Confirms active inflammatory response in vessel walls |
Practical Next Steps for Your Next Checkup
- Track before you go: White-coat syndrome can falsely inflate in-clinic blood pressure readings. Log home readings twice daily for 7 days before your lab appointment to give your doctor an accurate baseline.
- Review your tests side-by-side: When your lab portal updates, do not just glance at whether a marker is flagged “out of range.” Check your borderline lipid and kidney markers directly against your average blood pressure log.
- Ask the integrated question: Instead of asking “Are my labs normal?”, ask your clinician: “Given my blood pressure trends, how do my kidney and lipid panels look for long-term cardiovascular risk?”
Taking blood pressure and lab results together shifts healthcare from reacting to individual symptoms to protecting your vascular network as a unified system.