Categories Uncategorized

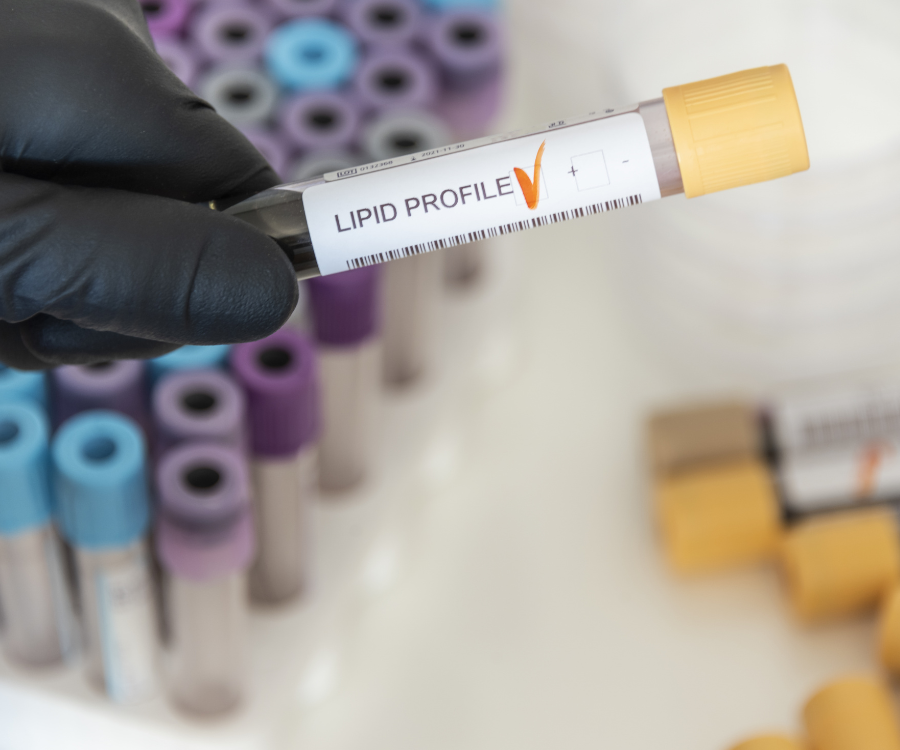
Blood Tests That Help Assess Your Risk of Heart Disease

The Standard Lipid Profile: The Baseline

A standard lipid panel measures the fats circulating in your bloodstream. It provides the foundation for most cardiovascular risk calculators.

  • Low-Density Lipoprotein (LDL-C): Known as “bad” cholesterol, elevated LDL-C contributes directly to fatty plaque accumulation inside arterial walls (atherosclerosis).
  • High-Density Lipoprotein (HDL-C): Referred to as “good” cholesterol, HDL-C helps scavenge excess cholesterol from tissues and transports it back to the liver for clearance.
  • Triglycerides: A type of circulating fat heavily influenced by diet, carbohydrate intake, and insulin sensitivity. Elevated levels frequently coincide with metabolic syndrome and accelerated plaque formation.
  • Total Cholesterol & Non-HDL: Total cholesterol provides a broad snapshot, but Non-HDL (Total Cholesterol minus HDL) captures all plaque-promoting particles combined, offering a more reliable risk measure than total cholesterol alone.

Advanced Biomarkers: The Deeper Picture

Standard lipid panels estimate risk by measuring the weight of cholesterol in your blood, but newer biomarkers assess the actual particle counts, genetic predisposition, and vascular inflammation.

BiomarkerWhat It MeasuresWhy It Matters
Apolipoprotein B (ApoB)The total number of atherogenic particles (LDL, VLDL, IDL).Each plaque-causing particle carries exactly one ApoB molecule. It reveals hidden plaque risk in individuals with normal LDL-C but high particle counts.
Lipoprotein(a) [Lp(a)]A genetically determined, LDL-like particle bound to apolipoprotein(a).Largely unaffected by diet or exercise, high Lp(a) levels increase clotting and accelerate plaque buildup. Most guidelines recommend testing it at least once in a lifetime.
hs-CRP (High-Sensitivity C-Reactive Protein)Low-grade systemic vascular inflammation.Inflammation makes arterial plaque unstable and prone to rupture, which is the direct trigger for most heart attacks.
Hemoglobin A1c (HbA1c)3-month average blood glucose control.Chronic insulin resistance and elevated blood sugar directly damage the endothelial lining of blood vessels.

Key Takeaways for Patients

  1. Start Early: Baseline cardiovascular blood screening should begin by age 20 and be repeated every 4 to 6 years if results are optimal, or more frequently if risk factors exist.
  2. Review Family History: If immediate relatives developed early cardiovascular disease, request advanced testing such as ApoB and Lp(a) alongside standard panels.
  3. Context Matters: Blood markers do not act in isolation. They are evaluated alongside resting blood pressure, lifestyle factors, and metabolic indicators to guide personalized prevention strategies.
Categories Uncategorized

What Does “Normal Range” Actually Mean on a Blood Test?

Opening a patient portal to see a bright red flag next to a lab result can send your pulse racing. It is easy to assume that falling outside the numbers printed on the page signals an immediate health crisis. In reality, laboratory reference ranges are statistical tools—not rigid boundaries between perfect health and illness.

Understanding how these numbers are created helps demystify your lab results and provides clearer context for your health.

How Labs Calculate the “Normal” Range

A reference range is established by testing a large sample of apparently healthy individuals. Because human biology varies widely, laboratories rely on statistics rather than absolute thresholds.

  • The 95% Rule: Labs typically plot test results along a standard bell curve. The “normal range” is defined as the central 95% of healthy results (spanning two standard deviations from the average).
  • The 5% Outliers: By mathematical design, 5% of completely healthy people fall outside this range—2.5% slightly above and 2.5% slightly below. A single flagged value often reflects natural biological variation rather than disease.

Why Reference Ranges Vary Across Laboratories

If you compare blood work from two different clinics, you might notice that the reference numbers for the exact same test do not match. Several factors influence how ranges are set:

VariableHow It Affects the Range
Testing Equipment & ReagentsDifferent analyzers and chemical assays measure biomarkers with slight methodological differences.
Demographics & PopulationRanges are frequently adjusted for biological sex, age, pregnancy, and local population baselines.
Time of Day & Fasting StatusCertain biomarkers, such as cortisol and glucose, fluctuate dramatically depending on circadian rhythm or recent meals.

“Normal” vs. “Optimal”

Being inside the reference range does not always mean your levels are performing at their best, just as falling slightly outside does not automatically mean something is wrong.

  • Borderline Trends Matter More Than Single Data Points: A fasting glucose level climbing steadily within the normal boundary over three consecutive years tells a clinician far more than a single isolated number.
  • Clinical Context Is Essential: A specific biomarker level might be normal for a sedentary 25-year-old but inadequate for a pregnant woman or an endurance athlete.

What to Do If Your Results Are Flagged

If your lab report shows an “out of range,” “high,” or “low” marker, keep these steps in mind:

  1. Avoid Self-Diagnosing: Look at the margin of difference. A value that misses the cutoff by 0.1 is rarely an emergency compared to a value double the upper limit.
  2. Review the Full Panel: Clinicians look at related markers together (such as liver enzymes alongside total protein and bilirubin) rather than evaluating an individual marker in a vacuum.
  3. Follow Up with Your Provider: Ask how the result aligns with your current symptoms, medications, hydration, and historical trends.

A blood test provides a snapshot of your physiology at a single point in time. Interpreted alongside your clinical history, reference ranges serve as a guide to prompt the right medical conversations—not a definitive pass/fail grade on your health.

Categories Uncategorized

Why Some Blood Tests Need to Be Repeated

Why Did My Doctor Order a Repeat Blood Test? Understanding the Reasons

Leaving a clinic only to get a follow-up call requesting a second blood draw can feel unsettling. It is completely natural for your mind to jump to worst-case scenarios, but the reality is far more routine: repeating a blood test is a standard clinical practice designed to ensure accuracy, safety, and proper diagnosis.

A single blood sample provides a snapshot of a single moment in time. Understanding why your healthcare provider needs a second look can help turn health anxiety into clarity.

1. Biological Fluctuations and Time-of-Day Variations

The human body is dynamic, and biomarker levels shift naturally throughout the day:

  • Hormonal rhythms: Hormones like cortisol and testosterone peak early in the morning and decline by the afternoon.
  • Hydration and diet: Dehydration can falsely elevate kidney markers like creatinine or alter electrolyte concentrations.
  • Temporary stress or illness: Mild infections, strenuous workouts, or high physical stress can temporarily spike white blood cell counts or liver enzymes without signaling a chronic issue.

A repeat test helps establish your true baseline rather than capturing an isolated spike or dip.

2. Verifying Borderline or Anomalous Results

Diagnostic reference ranges are built around statistical averages across large populations. When a biomarker lands just outside the standard cutoff—such as slightly elevated fasting glucose or marginally low thyroid-stimulating hormone (TSH)—doctors rarely diagnose on that single data point.

Re-testing allows your doctor to confirm whether the anomaly persists or naturally settles back into normal ranges before prescribing medication or ordering invasive procedures.

3. Strict Fasting or Preparation Protocols

Certain blood panels require strict pre-test preparation that can easily go off track:

  • Lipid panels and fasting glucose: Require 8 to 12 hours of complete fasting (water only).
  • Medication timing: Specific therapeutic drug levels must be drawn right before your next scheduled dose (trough level).
  • Supplements: High-dose biotin (vitamin B7) can significantly interfere with immunoassays for cardiac troponin and thyroid hormones.

If your initial sample was taken without meeting these conditions, a repeat draw under controlled guidelines is essential for valid numbers.

4. Technical and Laboratory Factors

Even with automated, state-of-the-art laboratory standards, pre-analytical sample issues occur:

IssueWhat It MeansWhy It Requires a Redraw
HemolysisRed blood cells rupture during collection or transitArtificially elevates potassium and alters liver enzymes
Clotted SampleMicro-clots form in anticoagulated tubesInvalidates complete blood count (CBC) and platelet counts
Insufficient Volume (QNS)“Quantity Not Sufficient” for all ordered panelsThe lab cannot run every necessary assay

5. Monitoring Treatment Response and Disease Progression

Repeat testing is also an intentional therapeutic tool. For chronic condition management, scheduled repeat tests evaluate whether an intervention is working effectively:

  • HbA1c: Checked every 3 to 6 months to assess long-term blood sugar control.
  • Thyroid panels: Repeated 6 to 8 weeks after adjusting levothyroxine dosages.
  • Inflammatory markers (CRP, ESR): Tracked to evaluate how autoimmune conditions or infections respond to therapy.

How to Prepare for Your Repeat Blood Draw

To make sure your second test goes smoothly:

  1. Clarify instructions: Confirm exact fasting requirements and whether regular morning medications should be taken or held until after the draw.
  2. Hydrate well: Drink plenty of plain water to make veins easier to access and keep plasma volume steady.
  3. Rest before collection: Avoid intense exercise within 24 hours of tests checking muscle enzymes (CK), liver markers, or kidney function.

Getting called back for a repeat blood test is rarely a medical emergency—it is simply your medical team prioritizing diagnostic precision over guesswork.

Categories Uncategorized

What a Lipid Profile Actually Tests

Getting your blood drawn for a routine checkup often ends with a lab report full of medical jargon: LDL, HDL, triglycerides, VLDL, total cholesterol. While it is easy to glance at the numbers and wait for your doctor to say “looks good,” understanding what a lipid profile actually measures puts your cardiovascular health directly into your hands.

A lipid panel is a simple blood test that measures the fats (lipids) circulating in your bloodstream. These molecules are essential for building cell membranes and producing hormones, but when they fall out of balance, they can increase the risk of plaque buildup in your arteries—a condition known as atherosclerosis.

The 5 Core Components of a Lipid Panel

When a laboratory analyzes your blood sample, it breaks down your lipid profile into five primary measurements:

1. Total Cholesterol

Total cholesterol represents the combined estimate of all the cholesterol floating in your blood. It acts as a starting baseline, though it does not tell the whole story on its own. A high total cholesterol score can be misleading if it is driven by high levels of protective HDL (“good”) cholesterol.

2. High-Density Lipoprotein (HDL) — “Good” Cholesterol

Think of HDL as the clean-up crew for your bloodstream. HDL acts like a molecular vacuum cleaner: it picks up excess cholesterol from your artery walls and carries it back to your liver, where it is broken down and eliminated from the body. Higher HDL levels are generally linked to lower cardiovascular risk.

3. Low-Density Lipoprotein (LDL) — “Bad” Cholesterol

LDL transports cholesterol from your liver out to the body’s tissues. While your body needs cholesterol to function, having too much circulating LDL can cause excess particles to lodge into vessel walls, where they oxidize and build up into hard plaques. Over time, this restricts blood flow and raises the risk of heart attacks or strokes.

4. Very Low-Density Lipoprotein (VLDL)

VLDL is another type of “bad” cholesterol particle, but instead of primarily carrying cholesterol, it carries triglycerides. Because directly measuring VLDL is difficult, labs typically estimate VLDL by dividing your triglyceride total by 5 (when measured in mg/dL). High VLDL levels are strongly linked to arterial plaque formation.

5. Triglycerides

Triglycerides are not cholesterol at all; they are the most common type of fat in your body. When you consume more calories than your body burns—especially from refined carbohydrates and alcohol—the excess energy is converted into triglycerides and stored in fat cells. High triglycerides combined with low HDL or high LDL significantly raise cardiovascular risk.

Standard Reference Ranges (mg/dL)

Lab ranges can vary slightly depending on the facility, but standard clinical target ranges for adult lipid panels are outlined below:

MarkerOptimal / Target RangeAt-Risk / High Range
Total CholesterolLess than 200 mg/dL240 mg/dL and above
HDL Cholesterol60 mg/dL or higher (40+ for men, 50+ for women)Less than 40 mg/dL (men) / 50 mg/dL (women)
LDL CholesterolLess than 100 mg/dL160 – 189 mg/dL (High) / 190+ mg/dL (Very High)
TriglyceridesLess than 150 mg/dL200 – 499 mg/dL (High) / 500+ mg/dL (Very High)

Key Ratios Your Doctor Examines

Looking at single markers only gives part of the picture. Doctors frequently examine calculated ratios to better assess overall heart health:

  • Non-HDL Cholesterol: Calculated by subtracting HDL from Total Cholesterol. This accounts for all “atherogenic” (plaque-forming) particles combined, making it one of the most reliable predictors of cardiovascular risk.
  • Total Cholesterol to HDL Ratio: Calculated by dividing Total Cholesterol by HDL. A target ratio is usually 5:1 or lower, with an optimal ratio around 3.5:1.
  • Triglyceride to HDL Ratio: Dividing triglycerides by HDL provides a quick screen for insulin resistance and particle density. A ratio below 2.0 is ideal.

Do You Need to Fast Before a Lipid Profile?

Historically, lipid tests required a 9 to 12-hour fast because eating recent meals directly inflates blood triglyceride levels, which skews calculated LDL levels.

However, modern guidelines permit non-fasting lipid panels for routine screening in most adults. Non-fasting tests accurately capture HDL, Total Cholesterol, and Non-HDL levels. If your non-fasting triglycerides come back elevated (above 175 mg/dL), your doctor may order a follow-up fasting test for precise confirmation.

Next Steps for Improving Your Lipid Profile

If your results come back outside optimal ranges, simple lifestyle adjustments often make a measurable impact:

  1. Increase Soluble Fiber: Dietary fiber found in oats, beans, flaxseeds, and apples binds to cholesterol in your digestive system and drags it out before absorption.
  2. Swap Saturated Fats for Unsaturated Fats: Replacing butter and fatty red meats with olive oil, avocados, nuts, and salmon lowers LDL levels.
  3. Engage in Regular Aerobic Activity: Moderate exercise (such as brisk walking for 30 minutes a day) boosts protective HDL levels while helping burn off excess triglycerides.
  4. Limit Refined Sugars & Alcohol: Cutting down on added sugars directly targets and reduces triglyceride counts.